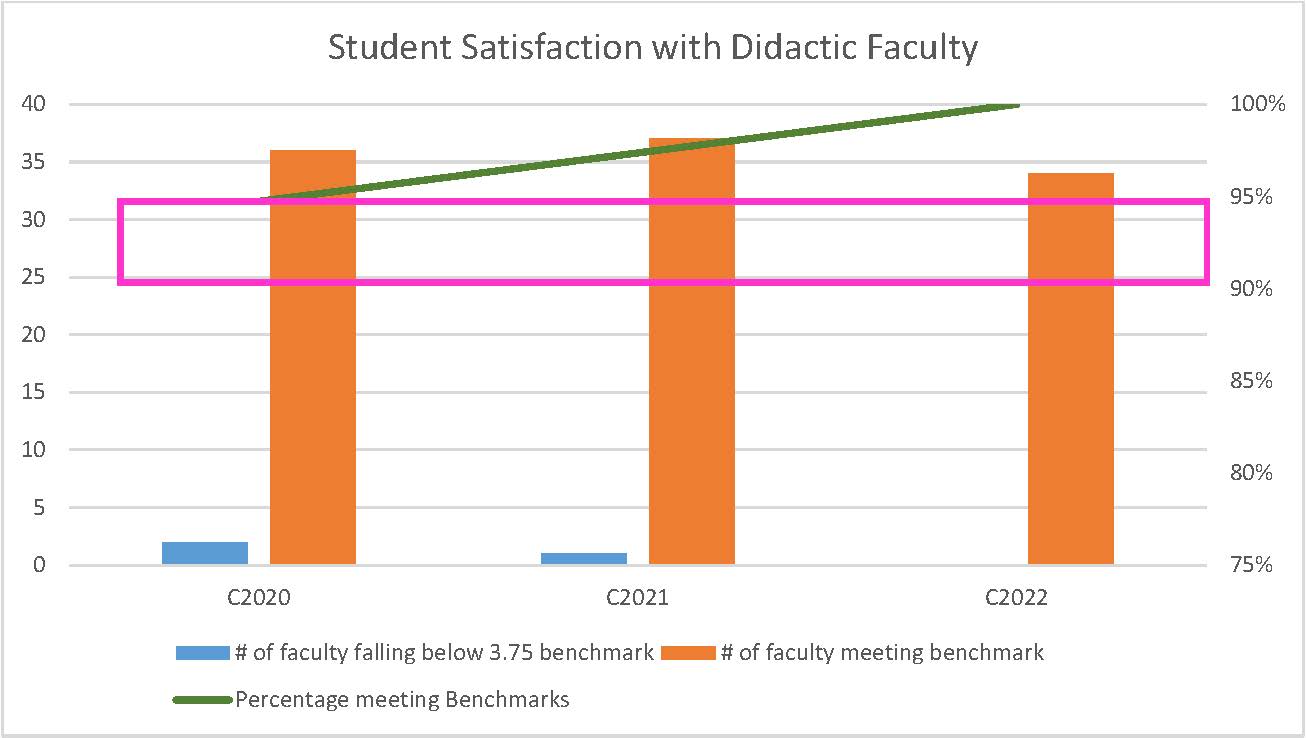
In Chart 1, the axis on the left indicates the number of faculty represented in each column with blue columns corresponding to number of faculty with an overall course evaluation falling below the program established benchmark of 3.75/5 on the 1-5 Likert scale utilized on the evaluation instrument. The orange column corresponds to evaluations of faculty with overall score at or above the 3.75/5 benchmark for student satisfaction. The axis on the right side of the chart correlates to the percentage of overall faculty evaluations that meet the minimum benchmark for student satisfaction (3.75/5). The green line represents the percentage of overall faculty evaluations that met the benchmark, demonstrated across the 3 cohorts. The pink box represents the program established benchmarks for effectiveness in meeting Goal 4. 90% of overall faculty evaluations meeting the 3.75/5 benchmark is defined by the program as meeting the goal of a “high level” of student satisfaction. 95% of overall faculty evaluations meeting the 3.75/5 benchmark is defined by the program as a strength with respect to Goal 4.

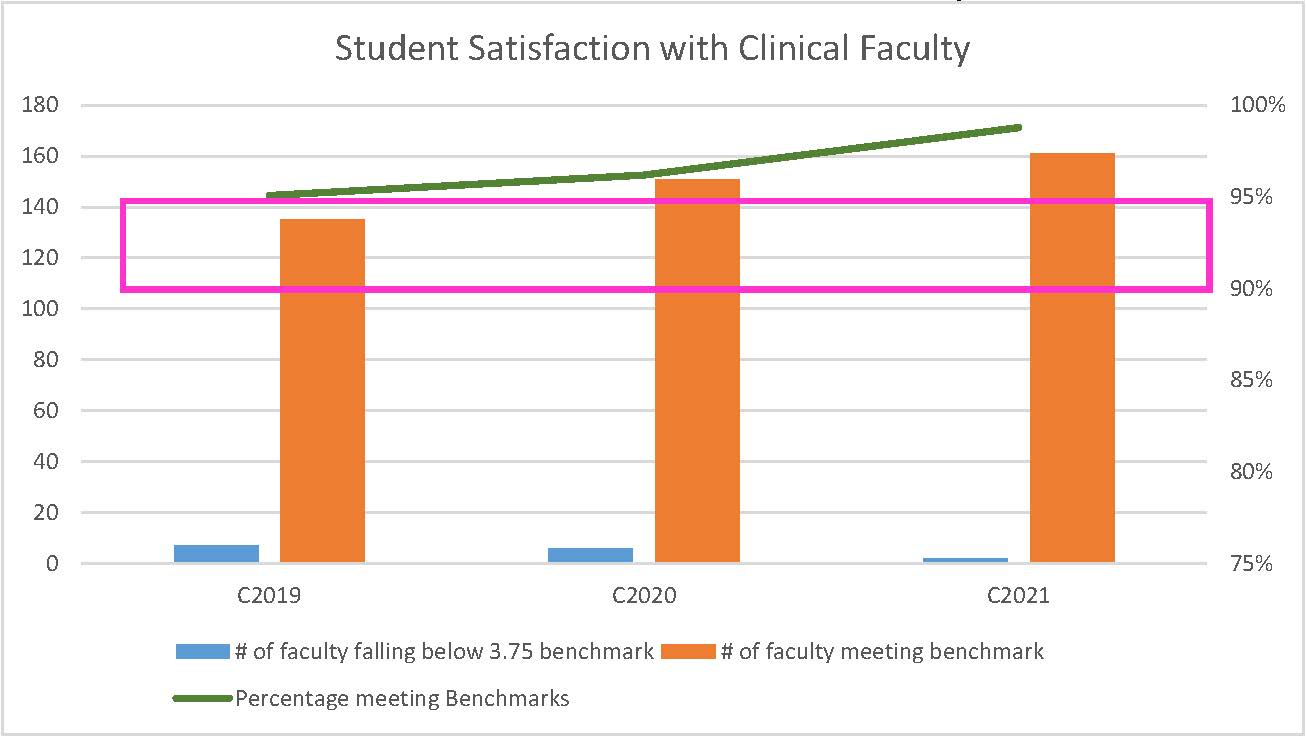
In Chart 2, the axis on the left indicates the number of clinical faculty (preceptors) represented in each column with blue columns corresponding to number of preceptors with an overall evaluation falling below the program established benchmark of 3.75/5 on the 1-5 Likert scale utilized on the evaluation instrument. The orange column corresponds to evaluations of preceptors with overall score at or above the 3.75/5 benchmark for student satisfaction. The axis on the right side of the chart correlates to the percentage of overall faculty evaluations that meet the minimum benchmark for student satisfaction (3.75/5). The green line represents the percentage of overall preceptor evaluations that met the benchmark, demonstrated across the 3 cohorts. The pink box represents the program established benchmarks for effectiveness in meeting Goal 4. 90% of overall preceptor evaluations meeting the 3.75/5 benchmark is defined by the program as meeting the goal of a “high level” of student satisfaction. 95% of overall preceptor evaluations meeting the 3.75/5 benchmark is defined by the program as a strength with respect to Goal 4.